Kubernetes tutorial
5. Installing Prometheus and Grafana using Helm
Installing Tiller, Kubernetes component of Helm
You already installed the Helm local client in the Prerequisites step. But now that you have the Kubernetes cluster set up and kubectl configured to talk to it, we need also to install the cluster’s component, called Tiller. More info here.
To install Tiller in the current Kubernetes cluster configured with kubectl, use:
helm init --history-max 200
It is a good practice to limit the history maximum number of items, as it can consume a big amount of space.
To check that Tiller pod is up and running use:
$ kubectl get pods --namespace kube-system

NAME                                    READY   STATUS    RESTARTS   AGE
coredns-696c4d987c-d4ssp                1/1     Running   0          2d9h
coredns-696c4d987c-wmwwj                1/1     Running   0          2d9h
coredns-autoscaler-657d77ffbf-tj7vf     1/1     Running   0          2d9h
kube-proxy-9kxnv                        1/1     Running   0          2d9h
kubernetes-dashboard-66d756f947-jft28   1/1     Running   0          2d9h
metrics-server-58699455bc-wvrjb         1/1     Running   0          2d9h
tiller-deploy-57f498469-prsfg           1/1     Running   0          58s
tunnelfront-6f4cb4755b-wjfvw            1/1     Running   0          2d9h
Installing prometheus-operator Helm chart
Helm uses a packaging format called charts. A chart is a collection of files that describe a related set of Kubernetes resources. The default location for Helm charts is their GitHub repository at: https://github.com/helm/charts.git
You can update the list of charts available using:
helm repo up
To search for a chart, you can use the search command:
helm search stable/prometheus-operator --versions --version=">=6" --col-width=30
We are going to install the prometheus-operator Helm chart. It is a complex package that is beyond the scope of what we can explain here, read its documentation for more information. Let’s summarize that is includes Prometheus to gather cluster’s metrics, Grafana to display a dashboard of those metrics, PrometheusRule to define alerting and recording rules, and Alertmanager.
If you just installed Tiller, wait a few seconds, and then install the prometheus-operator Helm chart, with the name prometheus in a namespace named monitoring.
helm install --namespace monitoring --name prometheus stable/prometheus-operator --set rbac.create=true
We need to specify the rbac.create=true variable for it to work in Azure, because it uses role-based access control (RBAC) to limit access to cluster resources.
To check Prometheus’ pods in the monitoring namespace use:
$ kubectl get pods --namespace monitoring
NAME                                                     READY   STATUS    RESTARTS   AGE
alertmanager-prometheus-prometheus-oper-alertmanager-0   2/2     Running   0          3m32s
prometheus-grafana-b4fb4d64d-j95b4                       2/2     Running   0          4m2s
prometheus-kube-state-metrics-6fc57fc485-tjb8s           1/1     Running   0          4m2s
prometheus-prometheus-node-exporter-6f6l4                1/1     Running   0          4m2s
prometheus-prometheus-oper-operator-cc4dfd77c-v5wsr      1/1     Running   0          4m2s
prometheus-prometheus-prometheus-oper-prometheus-0       0/3     Pending   0          3m26s
Accessing Prometheus web console
If you want to access Prometheus web console, we have to get its pod’s name first:
export POD_NAME=$(kubectl get pods --namespace monitoring -l "app=prometheus" -o jsonpath="{.items[0].metadata.name}")
Then we can open a proxy to it:
kubectl --namespace monitoring port-forward $POD_NAME 9090
And visit http://localhost:9090.
Accessing Grafana’s dashboard and setting it up
Now we are going to set up Grafana.
To know the password for login into Grafana, use:
kubectl get secret \
    --namespace monitoring prometheus-grafana \
    -o jsonpath="{.data.admin-password}" \
    | base64 --decode ; echo
We need to get Grafana pod name:
export NODE_GRAF=$(kubectl get pods --namespace monitoring -l "app=grafana,release=prometheus" -o jsonpath="{.items[0].metadata.name}")
Now we open a proxy to Grafana’s dashboard, and use admin username and the previous password to log in.
$ kubectl --namespace monitoring port-forward $NODE_GRAF 3000
And visit http://localhost:3000.
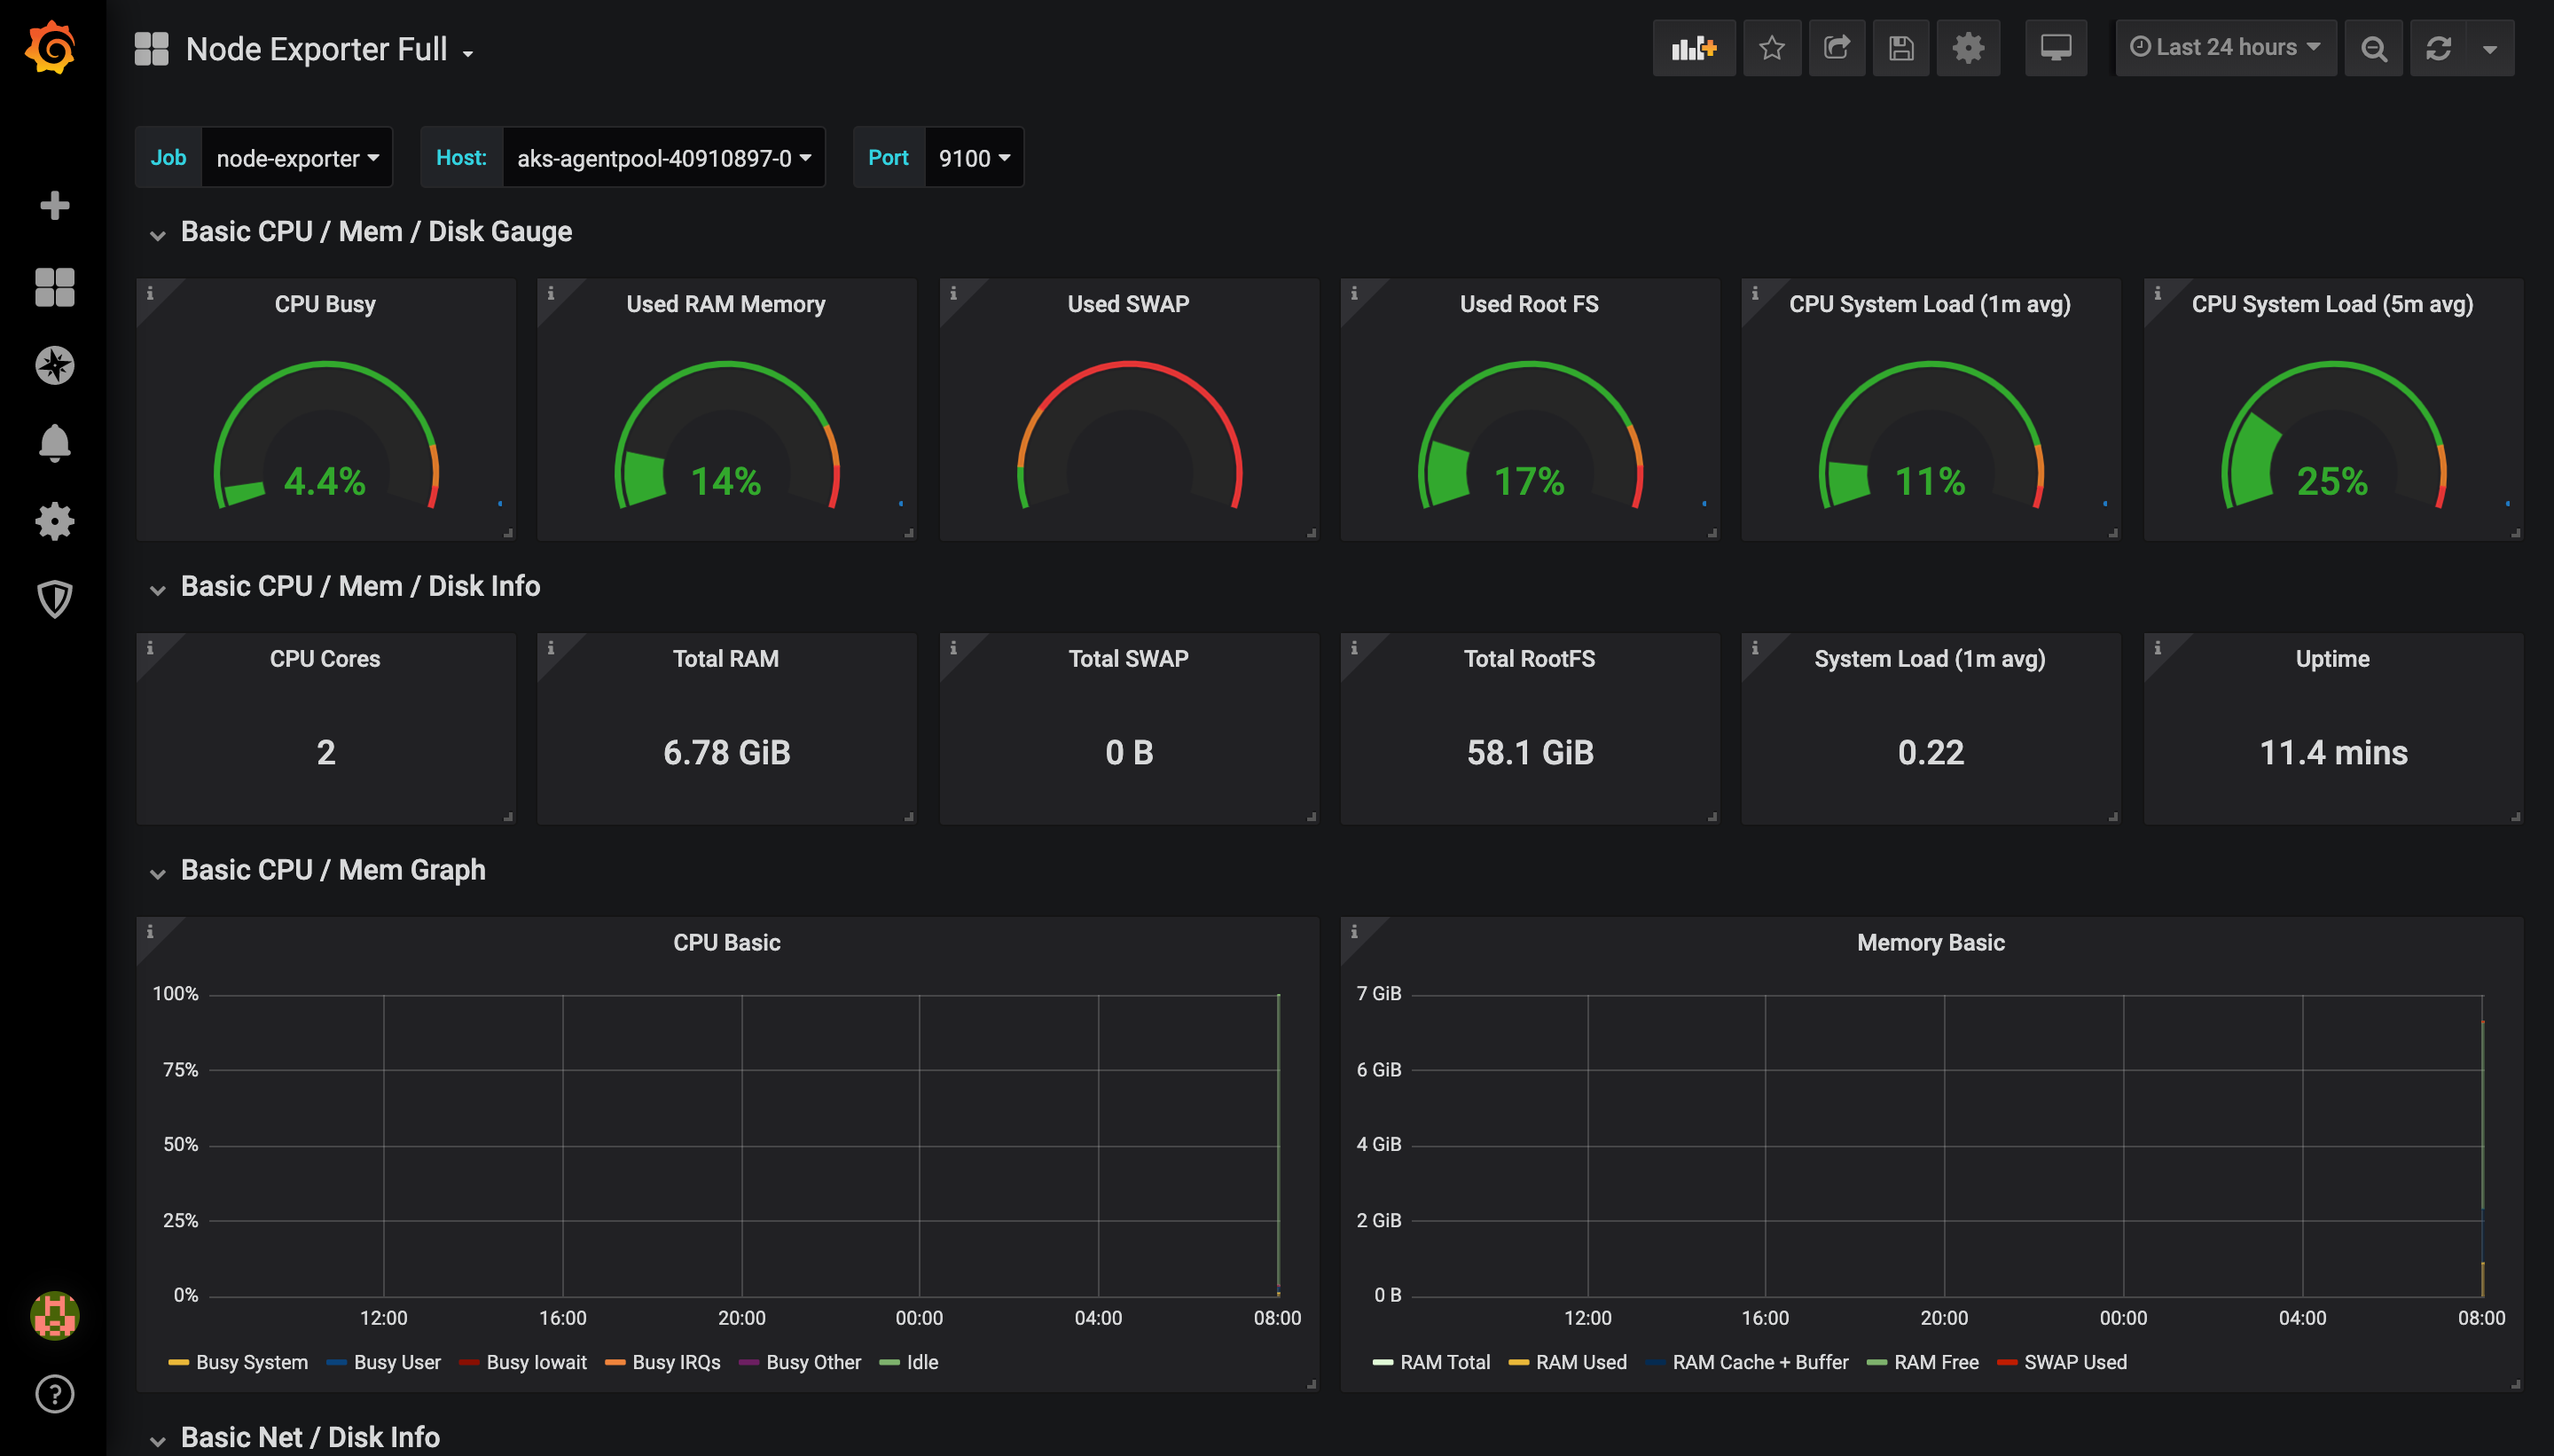
We need to define a dashboard for Grafana to represent Prometheus metrics. You can browse Grafana dashboards definitions at https://grafana.com/dashboards. We will use https://grafana.com/grafana/dashboards/1860.
Click import, load dashboard definition with id value of 1860, and select Prometheus as the data source.
You should see the dashboard’s instant metrics right away, and graphs will slowly start to display historical values.
Improvement: You can modify the prometheus-operator Helm chart to automatically deploy the Grafana dashboard configured. See this tutorial.
Improvement: Check this alternative to make Grafana use a random password on deployment.
Improvement: Describe creating users in Grafana, binding the output to the public IP address, and using a persistent storage.